One less tool to license.
GhostAnalyst includes a built-in NMS so you can monitor device availability, collect SSH metrics, and correlate network health with security events, all in the same platform. No PRTG. No Nagios. No extra subscription.
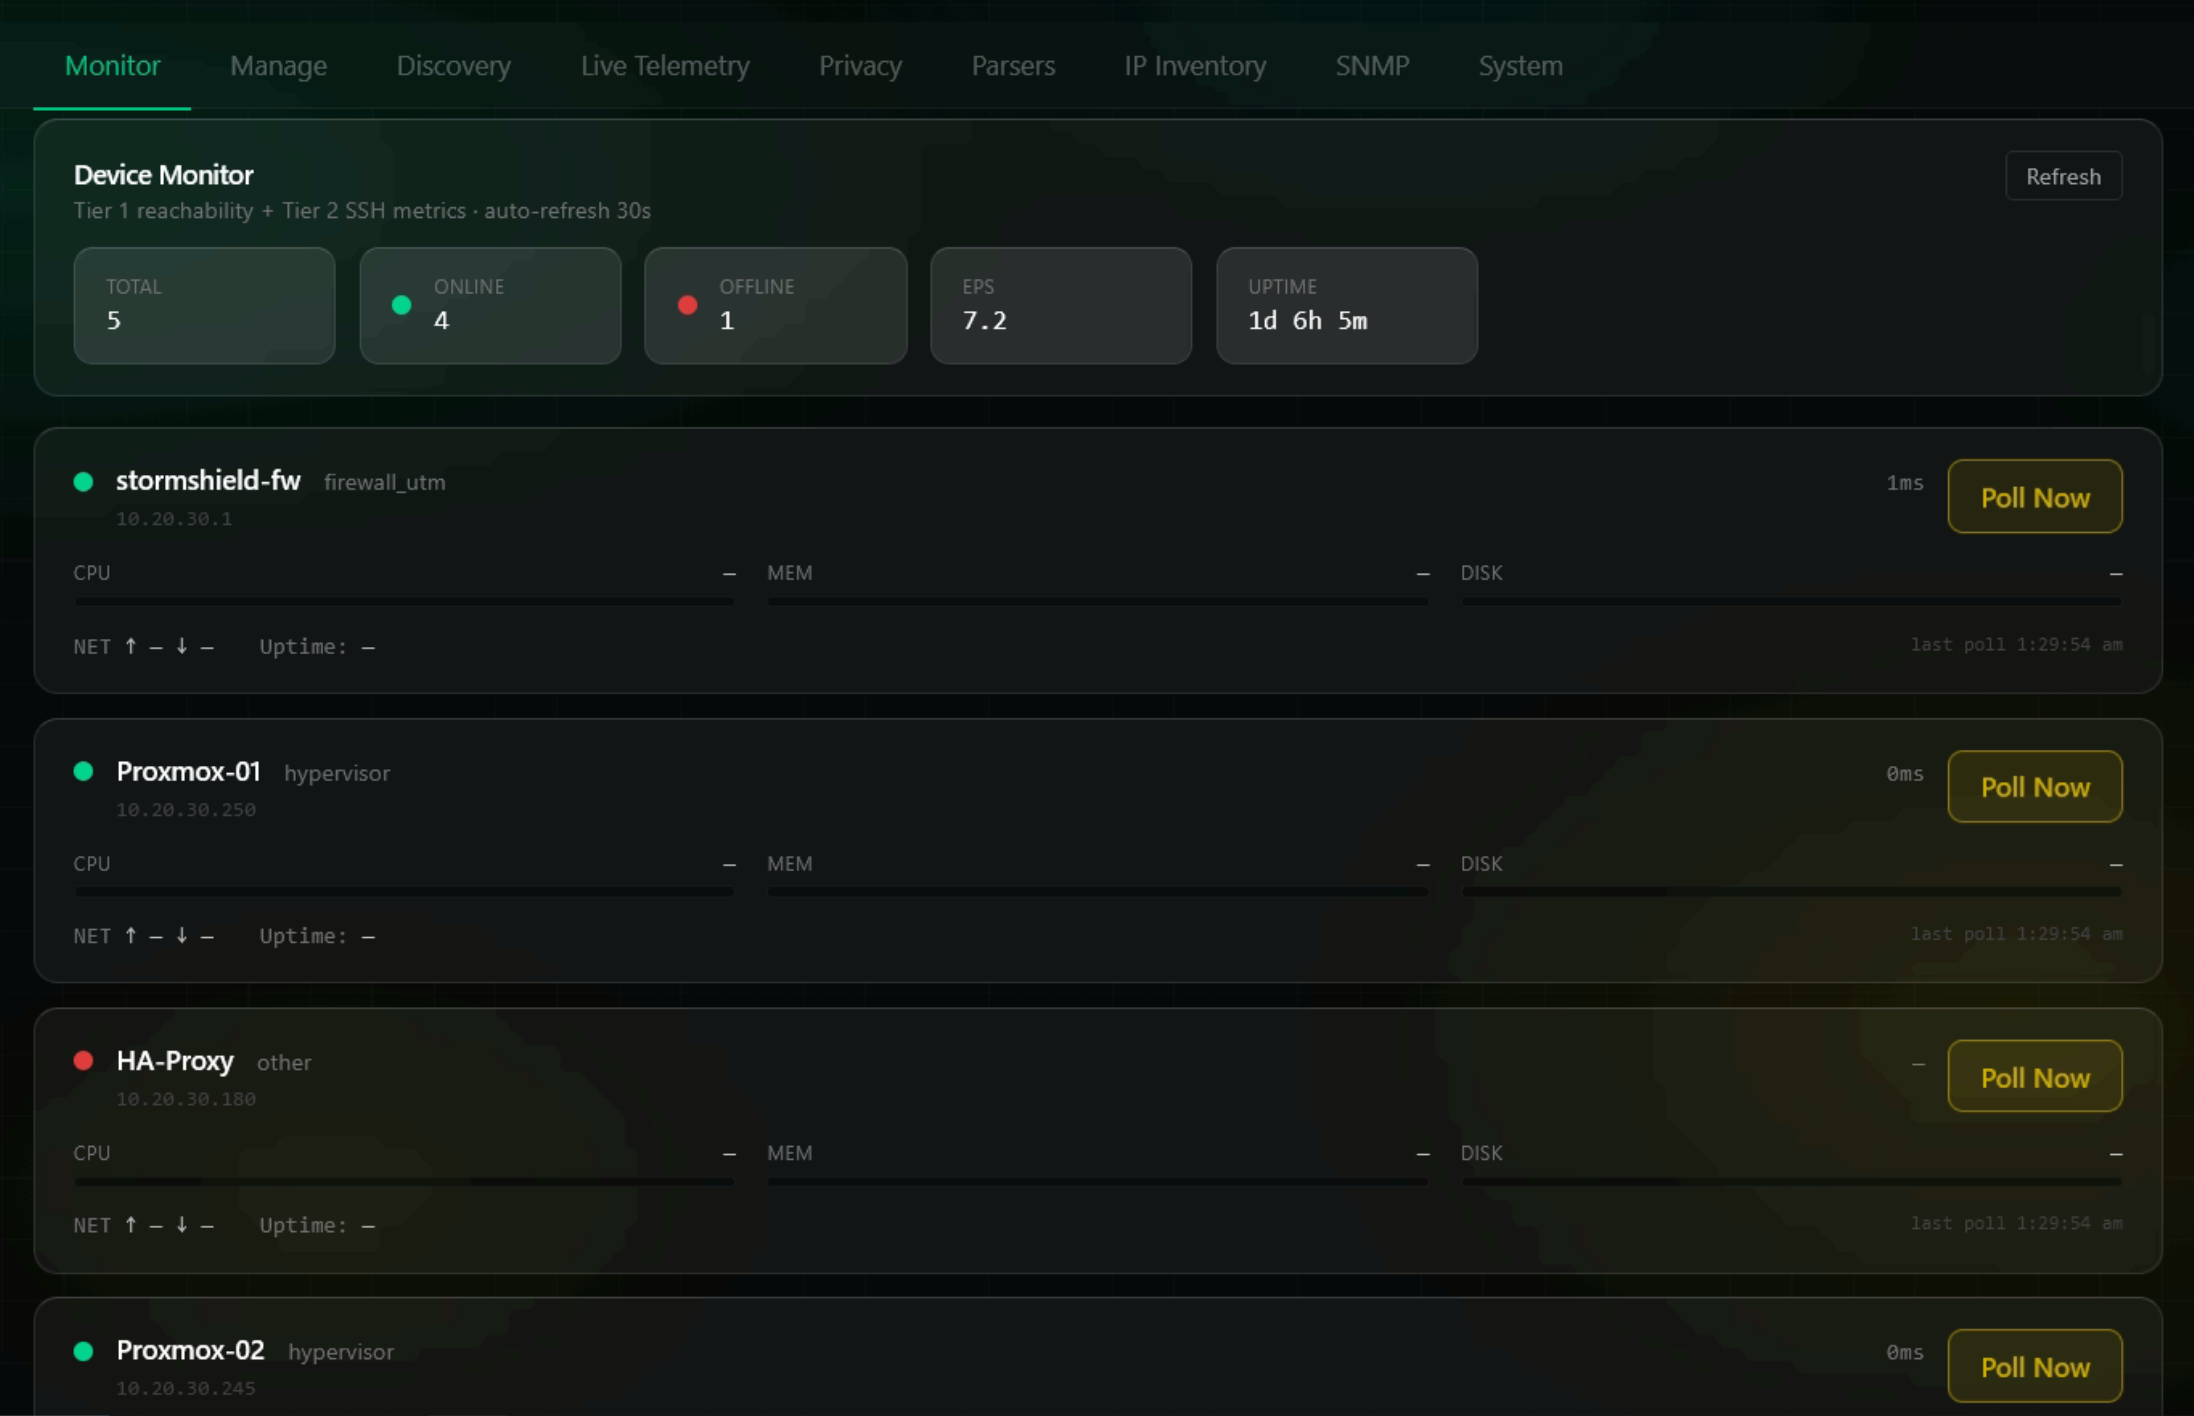
TCP Availability Checks
The Sidecar continuously checks TCP reachability for every monitored device. Down events generate Sidecar alerts and flow into the G-Score.
- --Configurable check interval per device
- --Down events escalated to Mission Control Detection Stream
- --Historical uptime tracked in ocsf.device_metrics
- --Alert suppression windows for scheduled maintenance
SSH Metrics Collection
For Linux and supported devices, the Sidecar collects CPU, memory, disk, and interface statistics over SSH without installing agents.
- --Agentless collection, no software installed on monitored hosts
- --CPU, RAM, disk, and network interface metrics per device
- --Fernet-encrypted SSH credential vault prevents credential exposure
- --Metrics stored in ocsf.device_metrics for trend analysis
Device Health Dashboard
Mission Control surfaces a unified device health view that combines availability, metrics, and security posture for every monitored device.
- --Single pane covering all devices across all subnets
- --Last-seen timestamp, availability percentage, and metric trend
- --Correlated with security events from the detection pipeline
- --Exportable as a scheduled NMS Report with AI executive summary
NMS Report
Generate a network monitoring report across any device set and time window, with a Forge-generated executive summary, centralised in the Regulatory Hub.
- --90-day report retention
- --AI executive summary, Forge-generated
- --Date range and device filters
- --Centralised in the Regulatory Hub
Reclaim your security data.
60-day full-platform trial. No credit card. No inbound firewall changes. Live in under an hour.