How bad is it right now?
One G-Score from 0 to 100 for your whole environment, in five bands from Low Activity to Critical Threat. A score of 80 or more opens a case automatically. Executives read the band; analysts drill into what moved it.
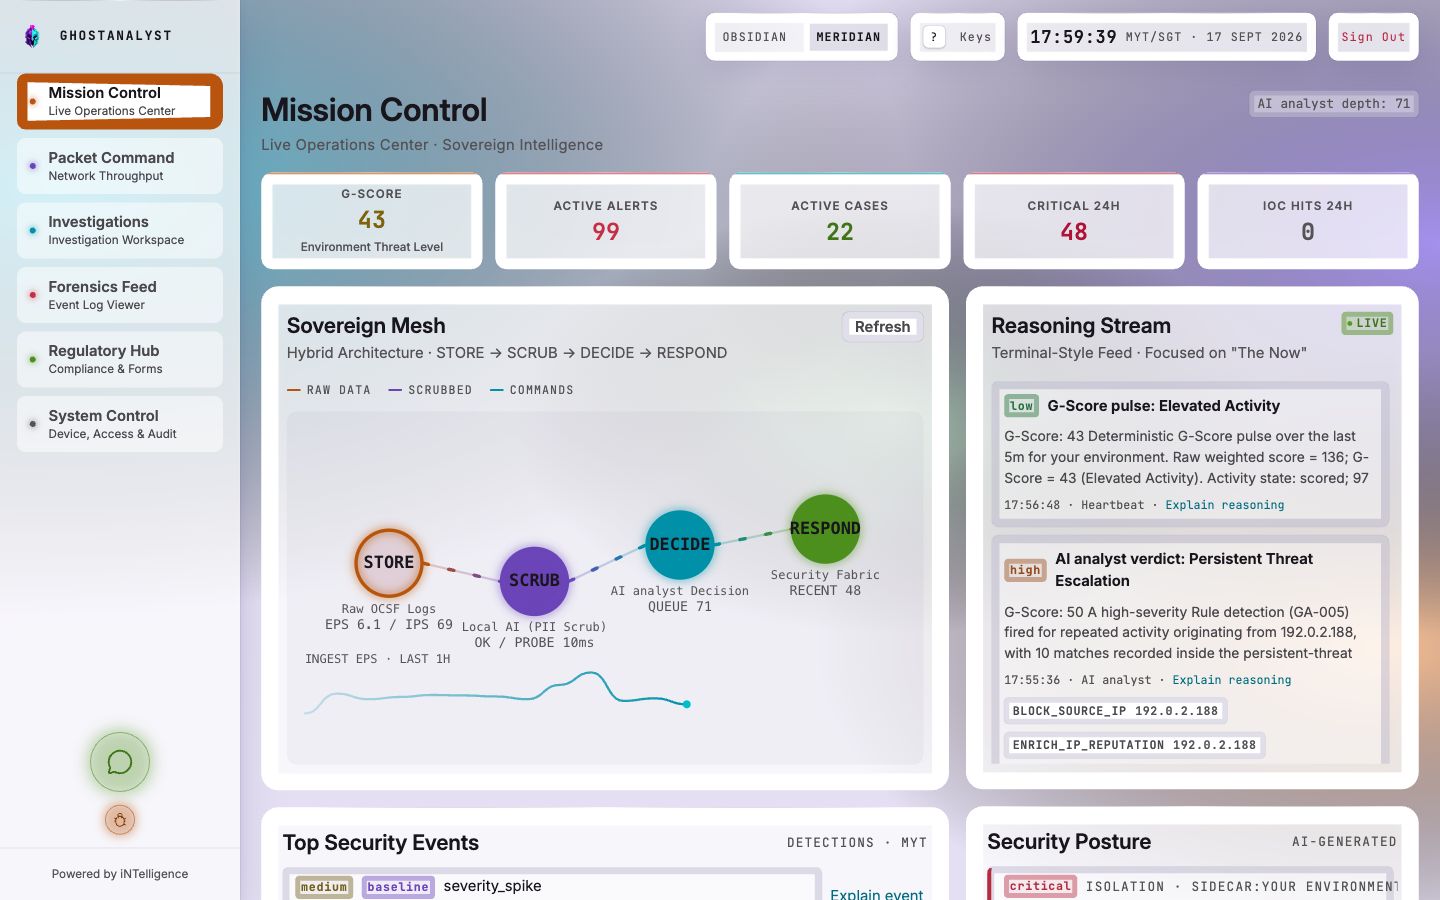
Your analysts open one view and see the G-Score, what changed since their last visit, the open cases and the reasoning behind every verdict.
Attack Path draws the worst recent attacks as threads: the outside addresses that came in, the server they reached, the inside hosts involved and where those hosts called out to next.
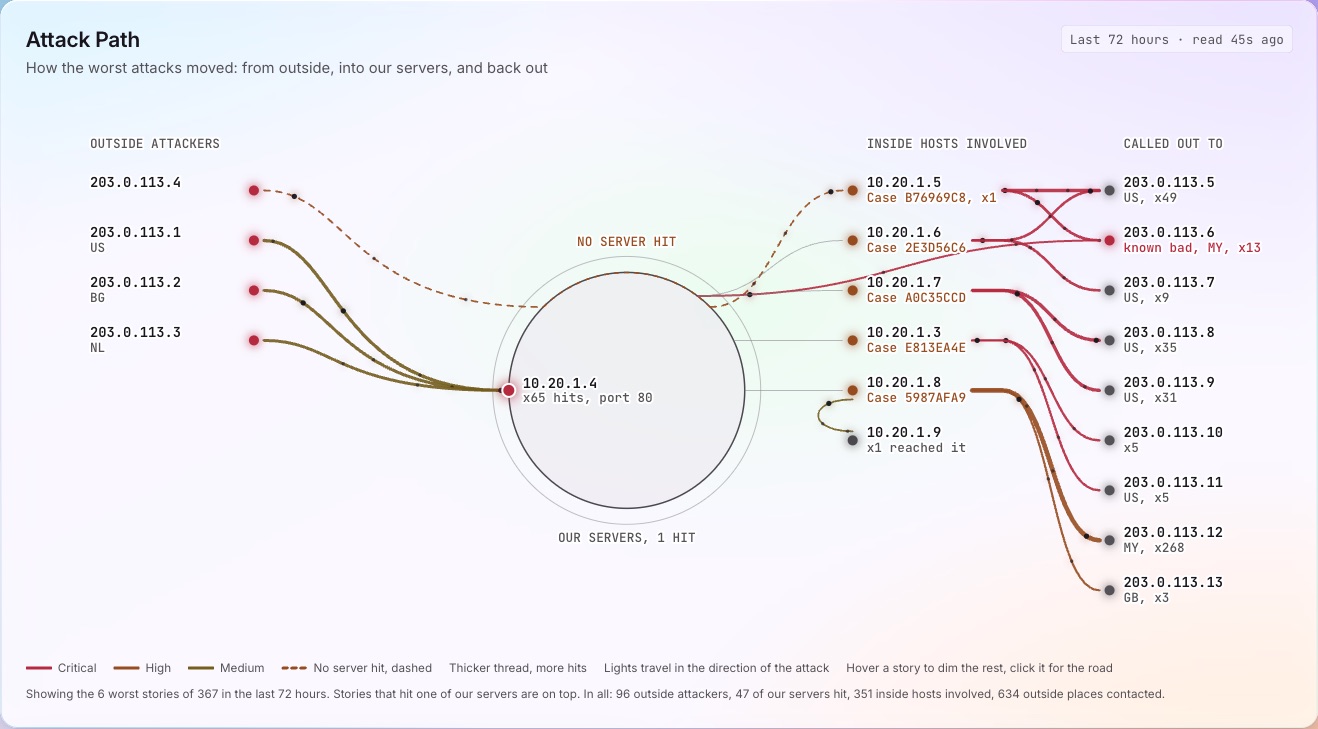
The rest of Mission Control shows how the noise was cut down, what was detected, what the outside world is warning about, and which attack techniques you can see.
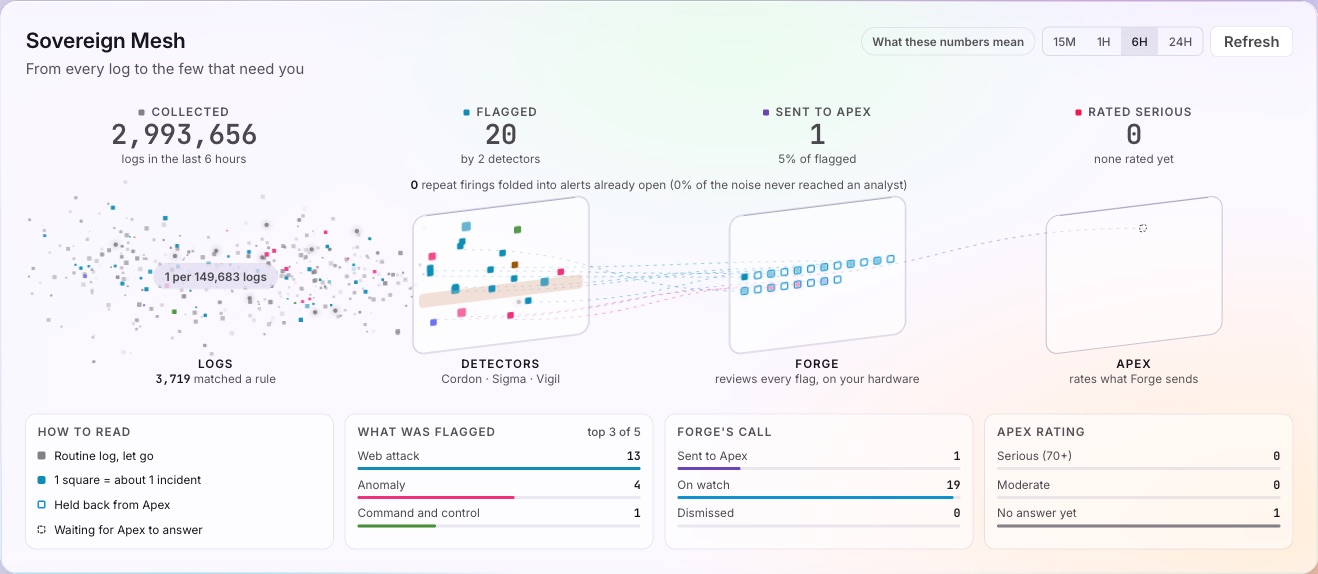
Every log in, a handful flagged, and how many reached a person.
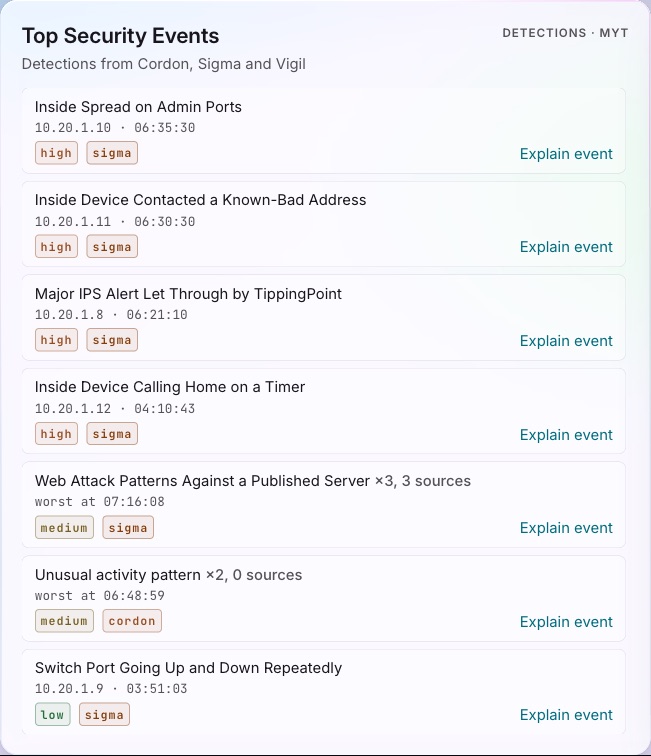
The strongest detections, named in plain words, each one a click from its explanation.
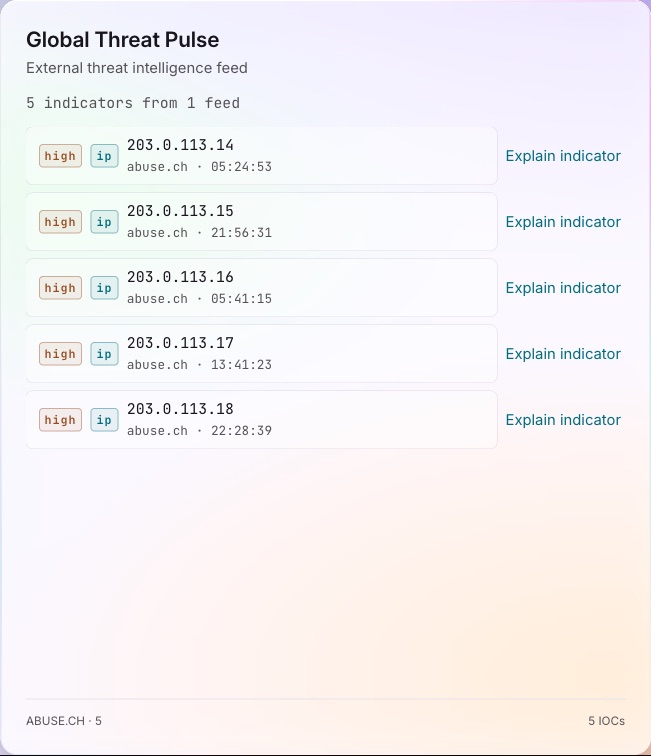
Known-bad addresses from outside threat feeds, checked against your own traffic.
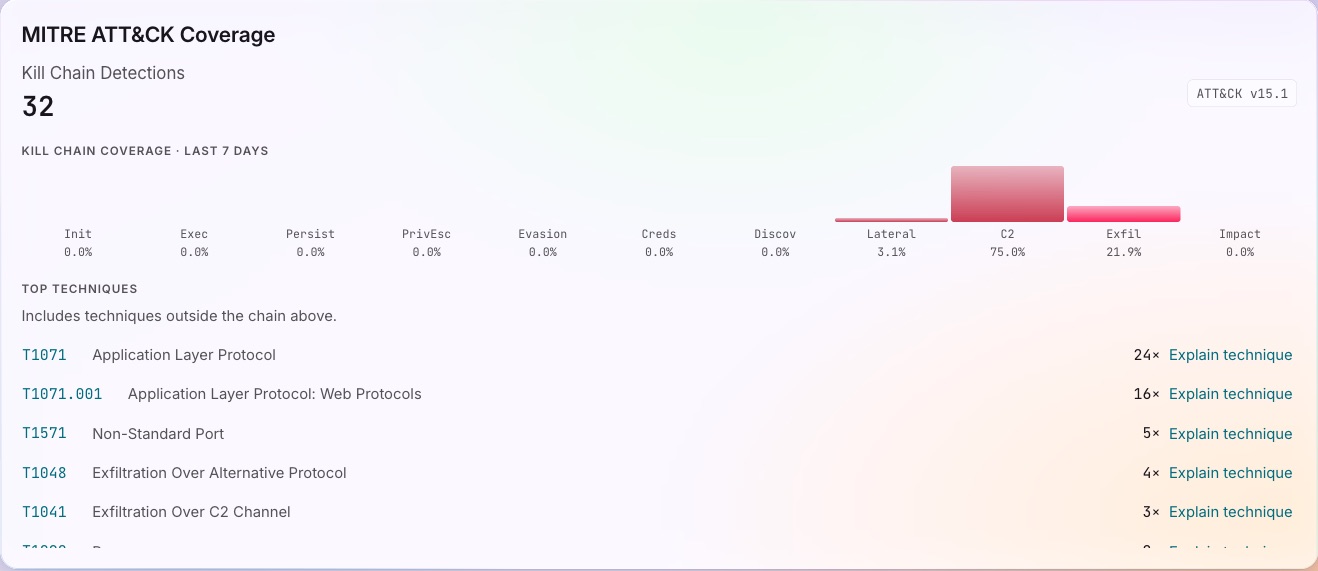
Which attack techniques your detections can see, and where the gaps are.
One G-Score from 0 to 100 for your whole environment, in five bands from Low Activity to Critical Threat. A score of 80 or more opens a case automatically. Executives read the band; analysts drill into what moved it.
Each verdict arrives with its reasoning in plain words and the MITRE ATT&CK technique it matches.
AI-generated recommendations drawn from your own recent telemetry, ranked by impact.
GhostAnalyst keeps counting what your devices log. Serious lines weigh more than routine ones, and the result is a score from 0 to 100 that tells you, at a glance, how busy the threat picture is right now.
Everyday background. Nothing stands out.
More lines than a quiet day, mostly routine.
More medium and high lines than usual. Worth a look.
Serious lines are piling up. An analyst should be on it.
Act now.
80: a case opens by itself
A smoke detector, not a verdict.
The score tells you when to look. The case, its evidence and the reasoning behind it tell you what happened.

By the time an event reaches Mission Control it has been collected on site, had emails and card numbers masked, read, triaged and explained.
The threat board in the investigation workspace lists the busiest sources by severity and event count, so the worst offender is always at the top.
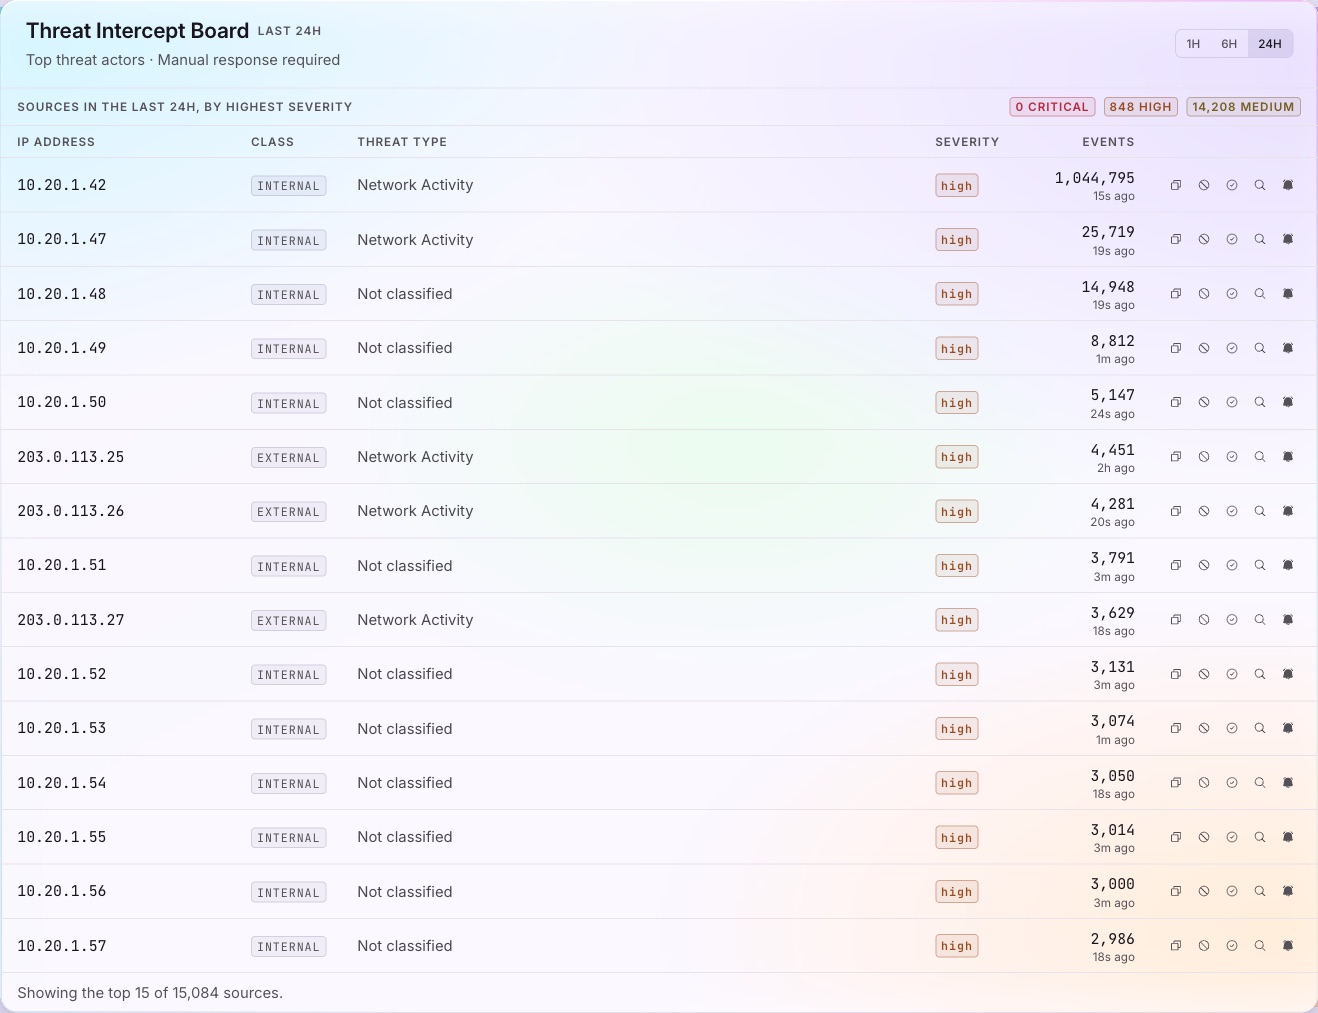
Open a case and the investigation is already written: the hosts involved, the destinations they reached, and a timeline of what happened next.
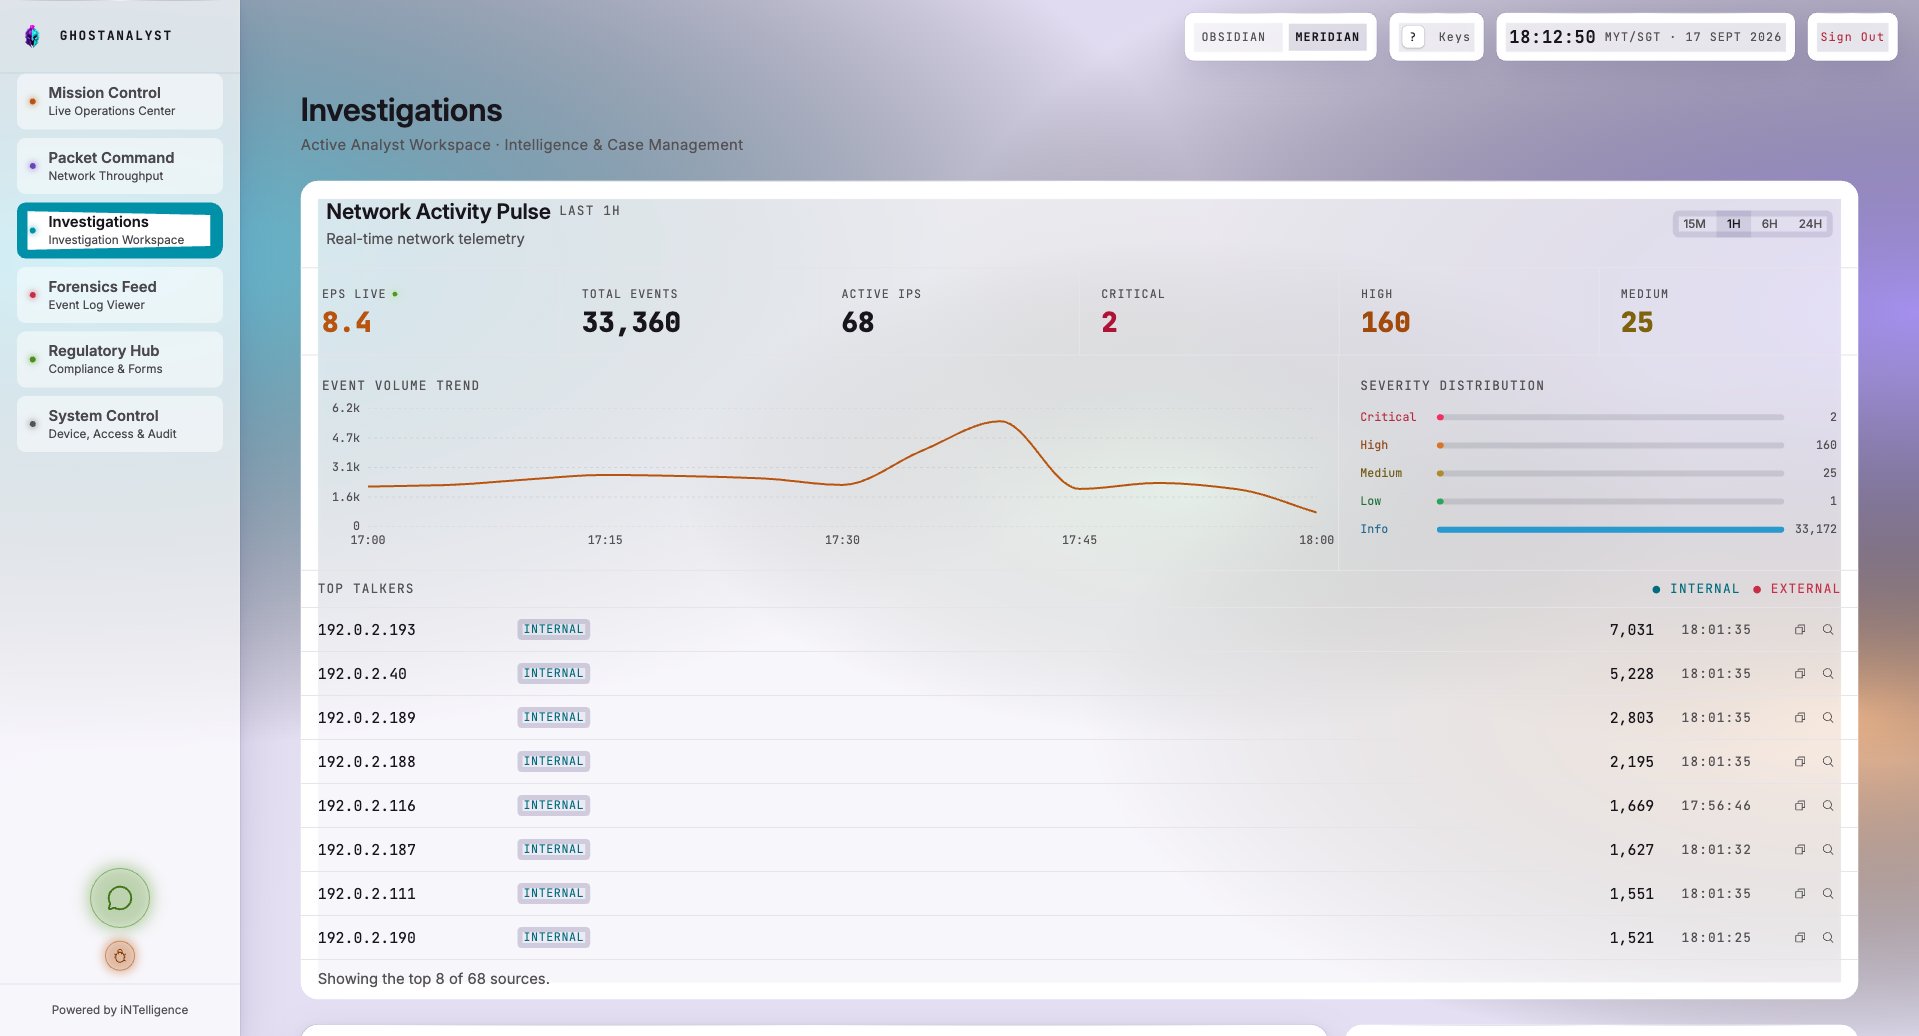
Open a Forensic run from a row on the Threat Intercept Board or from a case. The panel docks beside your view, shows each tool step as it finishes, then writes a report built on those steps.
Each claim in the report cites the tool step it came from. A claim without a cited step is removed before anyone sees it.
Every read the run makes is held to your own tenant. A read that is not scoped to you is refused.
A Forensic run also opens as a card in the iNTelligence chat, with the same steps and the same report.
A health chip tells the analyst when the hosted AI model is unavailable.
Starts the shift on the cases that matter, with the evidence already gathered.
Sees open cases, severity and workload across the whole network without asking for a report.
Reads one number and a short trend, and knows whether today is a normal day.
60-day full-platform trial. No credit card. No inbound firewall changes. Live in under an hour.
Hello. I am iNTelligence, the GhostAnalyst AI assistant. Ask me about our features, pricing, deployment, or how we compare to other SIEM platforms.